
Page 36 - Bullion World Issue 01 Volume 06 January_2026
P. 36
Bullion World | Volume 6 | Issue 01 | January 2026
Comprehensive Elliot Wave Analysis
of Gold's Historic Bull Market
Mr Rajeev Darji, Asst. Vice President - Research Analyst
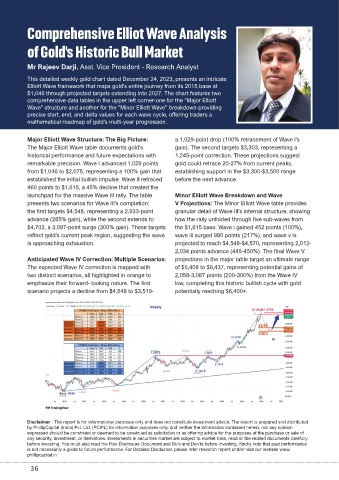
This detailed weekly gold chart dated December 24, 2023, presents an intricate
Elliott Wave framework that maps gold's entire journey from its 2015 base at
$1,046 through projected targets extending into 2027. The chart features two
comprehensive data tables in the upper left corner-one for the "Major Elliott
Wave" structure and another for the "Minor Elliott Wave" breakdown-providing
precise start, end, and delta values for each wave cycle, offering traders a
mathematical roadmap of gold's multi-year progression.
Major Elliott Wave Structure: The Big Picture: a 1,029-point drop (100% retracement of Wave I's
The Major Elliott Wave table documents gold's gain). The second targets $3,303, representing a
historical performance and future expectations with 1,245-point correction. These projections suggest
remarkable precision. Wave I advanced 1,029 points gold could retrace 20-27% from current peaks,
from $1,046 to $2,075, representing a 100% gain that establishing support in the $3,300-$3,500 range
established the initial bullish impulse. Wave II retraced before the next advance.
460 points to $1,615, a 45% decline that created the
launchpad for the massive Wave III rally. The table Minor Elliott Wave Breakdown and Wave
presents two scenarios for Wave III's completion: V Projections: The Minor Elliott Wave table provides
the first targets $4,548, representing a 2,933-point granular detail of Wave III's internal structure, showing
advance (285% gain), while the second extends to how the rally unfolded through five sub-waves from
$4,702, a 3,087-point surge (300% gain). These targets the $1,615 base. Wave i gained 452 points (100%),
reflect gold's current peak region, suggesting the wave wave iii surged 980 points (217%), and wave v is
is approaching exhaustion. projected to reach $4,548-$4,570, representing 2,012-
2,034 points advance (445-450%). The final Wave V
Anticipated Wave IV Correction: Multiple Scenarios: projections in the major table target an ultimate range
The expected Wave IV correction is mapped with of $5,408 to $6,437, representing potential gains of
two distinct scenarios, all highlighted in orange to 2,058-3,087 points (200-300%) from the Wave IV
emphasize their forward- looking nature. The first low, completing this historic bullish cycle with gold
scenario projects a decline from $4,548 to $3,519- potentially reaching $6,400+.
Disclaimer - The report is for informational purposes only and does not constitute investment advice. The report is prepared and distributed
by PhillipCapital (India) Pvt. Ltd. (PCIPL) for information purposes only, and neither the information contained herein, nor any opinion
expressed should be construed or deemed to be construed as solicitation or as offering advice for the purposes of the purchase or sale of
any security, investment, or derivatives. Investments in securities market are subject to market risks, read all the related documents carefully
before investing. You must also read the Risk Disclosure Document and Do’s and Don’ts before investing. Kindly note that past performance
is not necessarily a guide to future performance. For Detailed Disclaimer, please refer research report and/or visit our website www.
phillipcapital.in
36